About statistics
"Animal science engineers should be statisticianssaid Cheong, associate professor of veterinary medicine at Cornell University.
Needless to say, Japan has excellent veterinary and animal husbandry engineers, and excellent statistical scientists.
However, there are almost no examples in Japan where these two academic fields are linked and applied in research and on-site. In the United States, graduate students in veterinary and animal sciences are required to study statistics. In Japan as well, progress in the introduction of statistics-aware technology at dairy farming sites will lead to a deeper understanding of dairy science and the ability to discuss with overseas engineers in a common language. Below is a list of statistical terms commonly found in overseas dairy journals.
Significant difference
Significance is the probability that a difference occurs by chance (p: short for probability) is very low (less than 5% or 1% as is customary in statistics). for example"p<0.05 is considered significant.” In the example in the table below, the test plot was fed with yeast and the control plot was not fed, and when the milk yield in the test plot increased, statistical calculation was performedpIf the value is 0.02, there is a 98% chance that the increase in milk production was due to factors other than chance (i.e., yeast feeding), so the difference is considered significant.pIf the value is 0.20, there is an 80% probability that the difference is caused by factors other than chance, but the probability that the difference is caused by chance is 20%, which is clearly higher than 5% and is not significant. It is interpreted that it cannot be said that a has occurred.
ANOVA
ANOVA is an abbreviation for analysis of variance, and is translated as "analysis of variance" in Japanese. Analysis of variance is a method of analyzing whether the influence of each factor is significant or not when it is thought that two or more factors influence a certain result. If there is only one factor, a method called t-test can be used. However, it is not often the case that a single factor influences the outcome of "increased milk yield" or "improved reproduction" in the field.
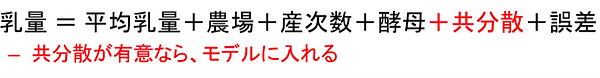
Below is an example of what factors (=factors) determine the milk yield of a dairy cow. Factors include the average milk yield, which is universal in each country or region, and the error, which is a difference caused by chance. In addition, the difference in feeding management between farms may be a factor of farm differences. Litter order can also be a factor. The presence or absence of additive yeast feeding may also have an effect.
Once these factors that determine milk yield have been isolated, the next step is to analyze whether each factor really has an effect. That is the analysis of variance.
ANOVA examines whether the influence of each factor is greater or less than the influence of error (formula below). If it is significantly larger, it can be judged that "the factor has a significant impact on milk yield, not by chance."
A key part of analysis of variance is the decomposition of effects by factors. This is because other factors may be hidden in the error. If other factors are hidden in the error, it will lead to overlooking important factors that influence the result (milk yield in this case), and the accuracy of the analysis of variance itself will decrease. The thought process that separates factors other than chance (= error) is to improve the result in the field, or if the result is lower than expected, what is affecting it_d04a07d8-9cd1-3239-9149- 20813d6c673b_It also helps to analyze.
covariance
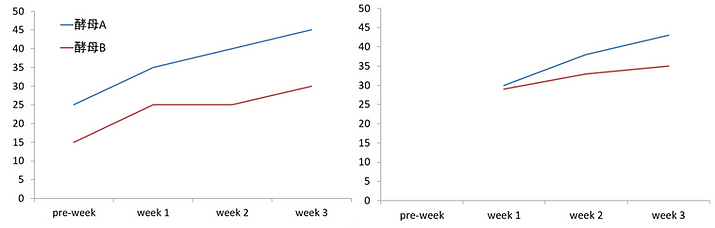
Covariance appears frequently in the Journal of Dairy Science under the word covariate. The significance of taking covariance into consideration at the dairy farm should be understood as "aligning the starting line." The left graph below shows that yeast A produced more milk than yeast B in the yeast feeding test. However, in this graph, there is already a difference in the pre-week before the start of the test, and it is not clear whether yeast A really increased milk production.
Therefore, it is possible to analyze whether the milk yield in the pre-week is a factor that affects the subsequent milk yield. In this case, the covariance is "milk yield at pre-week". The graph on the right shows the result of separating the covariance as a factor and re-analyzing yeast. Failure to separate the covariances increases the risk of each factor being overestimated or underestimated.
covariance structure
The covariate structure is abbreviated as covariate structure and is one of the factors to consider when conducting time course studies on animals. Needless to say, when new factors such as feed ingredients are changed or feed design is added at the site, evaluation is performed over time.When evaluating changes over time in daily milk yield and weekly milk components, it cannot be said that the milk yield and milk components at each point in time are independent of each other. This is because the results at this point in time may be influenced by the previous point in time and influence the next point in time.
In the figure below, the dotted line indicates the correlation between the milk yields at each point in the blue line.
In other words, the same individual has the same production capacity over time, and a cow with high milk production today may maintain high milk production the next day and the day after that. The correlation between volume and daily milk yield needs to be evaluated separately. The method of evaluating the correlation is "confirmation of covariance structure". As mentioned earlier in the covariance section, checking for correlations and incorporating them into the model allows us to determine the effect of each factor influencing the results without underestimating or overestimating them.
There are many types of covariance structures, and the targetThe method of choosing the covariance structure that best fits the time course is well recognized in the Journal of Dairy Science papers.
Sample size
Another consideration in evaluating test and control plots is sample size. When a certain factor is introduced, as an extreme example, one animal in the test group and one animal in the control group raises doubts about the credibility of the evaluation results.
The purpose of the statistical evaluation is to confirm the universal acceptance of the test results obtained. Since it is impossible to divide all cattle in Japan into test and control groups, instead, representative cattle are randomly selected (sampled), assigned to each group, and tested. If you do statistical analysis, you can check whether it is effective and not by chance. Number of animals assigned to the wardThis scale is called the sample size.
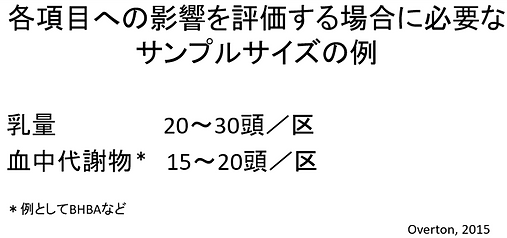
The valid sample size is, determined by the size of the effect of the factor and the degree of variability of the items evaluated. For example, if a new feed ingredient is adopted, the required sample size will be different depending on whether the milk yield is increased by 0.5 kg or by 5 kg. The appropriate sample size also depends on whether the universal variation in milk yield is between 28 and 32 kg, or whether the range extends from 20 to 40 kg.
Lower reference sample size in dairy scienceAs indicated, it is better to calculate the sample size for each individual factor in order to increase the accuracy of the statistical analysis. Also, in the field, when introducing and evaluating new technologies and feeds, it is easier to make a decision to introduce them if the test is planned considering "whether this number of test animals is sufficient" and the results are examined. increase.
standard error
SE or SEM in dairy journalsThe standard error displayed as is one of the items to understand when reading data. The standard error indicates how much the mean will vary if you repeatedly sample a universal population (expressed as a population in statistics) and calculate the mean of that sample. It can be interpreted as the estimated range of the mean of the population, and if the standard error is large, it can be interpreted that the influence of a certain factor is highly variable.
Standard deviation, on the other hand, is expressed as SD, which simply indicates the degree of variability of some data. However, useful information in the field is ``what kind of average value is obtained when a certain factor is introduced to all cattle in the country, and what is the estimated range?'' Therefore, the mean value ± standard error If there is the data of the paper, it can be a guideline and a basis for introducing the factor.
In addition, there are cases where the graph shows the error bar of the standard error of each ward (see below), and the table shows the maximum standard error in each ward (see below). It is read as confirmation of the variability of the evaluation item itself.